ESnet Releases Open Source Software from MyESnet Portal for Building Online Interactive Network Portals
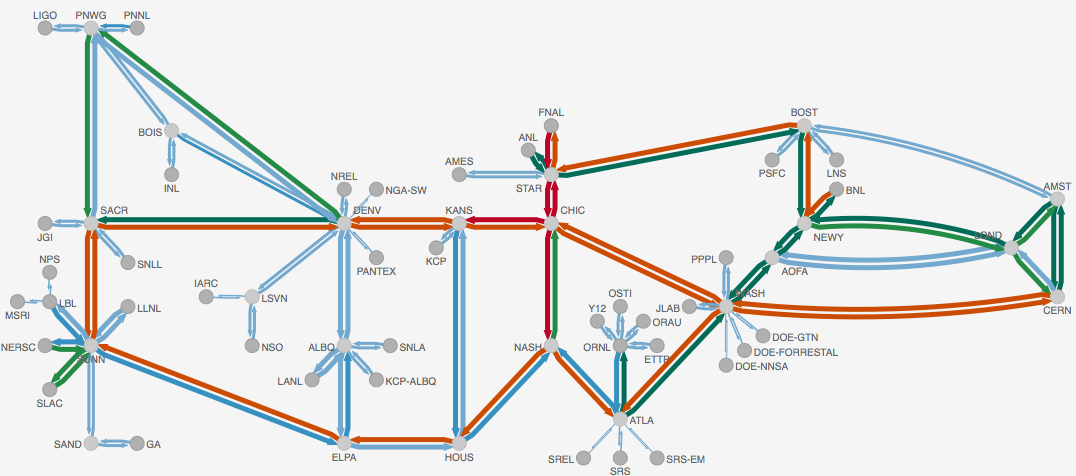
ESnet is making available the software to create maps like this one on the My.ES.net portal.
By Jon Bashor
Contact: cscomms@lbl.gov
When ESnet, the Department of Energy’s (DOE) Energy Sciences Network, unveiled its online interactive network portal called MyESnet in July of 2011, the reaction was strongly positive – other research and education networks liked it so much, they wanted the code to create their own portals.
After four years of development and refinement, they will get their wish. On Oct. 5, Jon Dugan of ESnet’s Tool Team will give a presentation on “ESnet’s Network Visualization Toolkit” at the 2015 Technology Exchange conference in Cleveland, Ohio. About 500 network experts from around the world are expected to attend the meeting.
“People really appreciate MyESnet, which we think is a great visualization of the network and network data. We have received a lot of queries from the community to help them create a similar portal,” said ESnet Chief Technologist Inder Monga, who leads the Tools Team. “So as a way of giving back to the community, we are releasing as open source three software libraries we developed that provide critical components to create the portal.”
The idea to develop the libraries grew out of the strong desire from the community to leverage the portal software for their own networks. The problem was that the portal itself was strongly tied to the way ESnet works and it wasn’t clear how to make it general enough for others to use. Instead of open sourcing the entire portal, the team decided to focus on factoring out the general purpose pieces and open sourcing those. Breaking out the general purpose code also made the remaining portal code cleaner and easier to maintain. “We did a lot of this for our own sanity,” Dugan said with a smile.
There are three reusable pieces that are being made available now as open source:
● Pond (unifying time series abstraction)
The charting library and the network diagrams library are built using React, an open-source library for creating user interfaces developed by Facebook in JavaScript.
ESnet, a DOE Office of Science User Facility, is funded by DOE and managed by Lawrence Berkeley National Laboratory. Since ESnet serves 40 DOE sites in the U.S., has a combined 340 GBPS connectivity to Europe and peers with 140 other networks, keeping track of network performance is critical.
To monitor network performance, ESnet gathers data from 8,000 different interfaces on the network every 30 seconds, letting the staff know how fast and how much data is being carried on the network, explained team member Peter Murphy. Murphy said the goal was to develop a consistent way to visualize this data as it came in from many different sources.
The Time Series Charts Library is focused on showing a series of measurements over time such as the network performance measurements that ESnet collects. This kind of chart is used many places in the MyESnet portal. For example, a user can click on any part of the map on the home page, whether a network link or end node, and see a plot of network traffic in each direction over time. Clicking on an end node, like the National Energy Research Scientific Computing Center (NERSC)—also a DOE Office of Science User Facility—a user can view charts showing the top 10 countries exchanging data with the center, the percent availability of the connection, traffic flow by protocol, and more. These charts are all produced by the library. When using the library, a developer can arrange, stack and add the appropriate charts to create a customized display of data in a declarative manner. The declarative approach means that the developer provides a description of how the charts should work and the library takes care of the details.
The front page of the MyESnet portal presents a simplified, high-level view of the network by combining and simplifying some aspects of the network. This map is created using the Network Diagram Library. This library has also been used in the internal ESDB project to visualize the linear topologies of point to point network circuits. This library allows developers to take topology data to create a network diagram and then customize the appearance and interaction of the diagram to suit the needs of the task at hand. Developers can customize a map to show the paths, bandwidth, level of data traffic, edges and nodes. The library works in a declarative manner as well.
Both the time series charts library and the network diagram library have a need for a common representation of time series data. Pond provides a unified representation of time series data which is lightweight and easy to use. In addition to providing a common format for time series data it provides a number of operations on time series such as forming samples into regularly spaced bins and basic operations like minimum and maximum. Pond is used by both the time series chart library and the network diagram library. Ostensibly named for a pool of data shimmering in the sun, Pond shares its name with Amelia “Amy” Pond, the time-traveling companion of Doctor Who.
Now that the libraries are made available, the team hopes that other organizations will take the code, use it, add to it and work with ESnet to make the improvements available to the community. “Ideally, other folks will come up with new and interesting ways to look at their data since they don’t need to re-create the visualizations these libraries provide,” Dugan said. “That’s the virtuous circle of open source software.” The team also sees expanded uses for the libraries, such as security and IT staff using the tools to explore event logs or any other place where there is a need to display time series data on a website.
About the ESnet and the DOE Office of Science
ESnet is managed by Lawrence Berkeley National Laboratory, which is supported by the Office of Science of the U.S. Department of Energy. The Office of Science is the single largest supporter of basic research in the physical sciences in the United States, and is working to address some of the most pressing challenges of our time. For more information, please visit science.energy.gov.
The Energy Sciences Network (ESnet) is a high-performance, unclassified network built to support scientific research. ESnet provides services to more than 40 DOE research sites, including the entire National Laboratory system, its supercomputing facilities, and its major scientific instruments. ESnet also connects to 140 research and commercial networks, permitting DOE-funded scientists to productively collaborate with partners around the world.